Observability
Gain insights into how your team works and what you can do to make them more effective.
Find bottlenecks, fix problems and keep things running smoothly.
Key Features
-
Automatic Reports
As your team works, reports are automatically generated for you. Keep an eye on process flows and easily spot bottlenecks and places where things can be improved.
-
Notifications
Be early to know when your processes are falling behind or about to trigger a threshold. Configure alarms and notifications that trigger when real-time analytics reveal a cause for concern.
-
Drive Engagement
Respond quickly to trends and shifts in customer engagement. Deliver smarter, trained content to the APIs and AI Models that power your customer-facing sites and applications.
Observability
Take advantage of integrated reports to analyze and deeply understand your team's performance as well as the value of your content store. Find bottlenecks and get actionable insights to continuously optimize your system usage and workflow processes for greater efficiency.
-
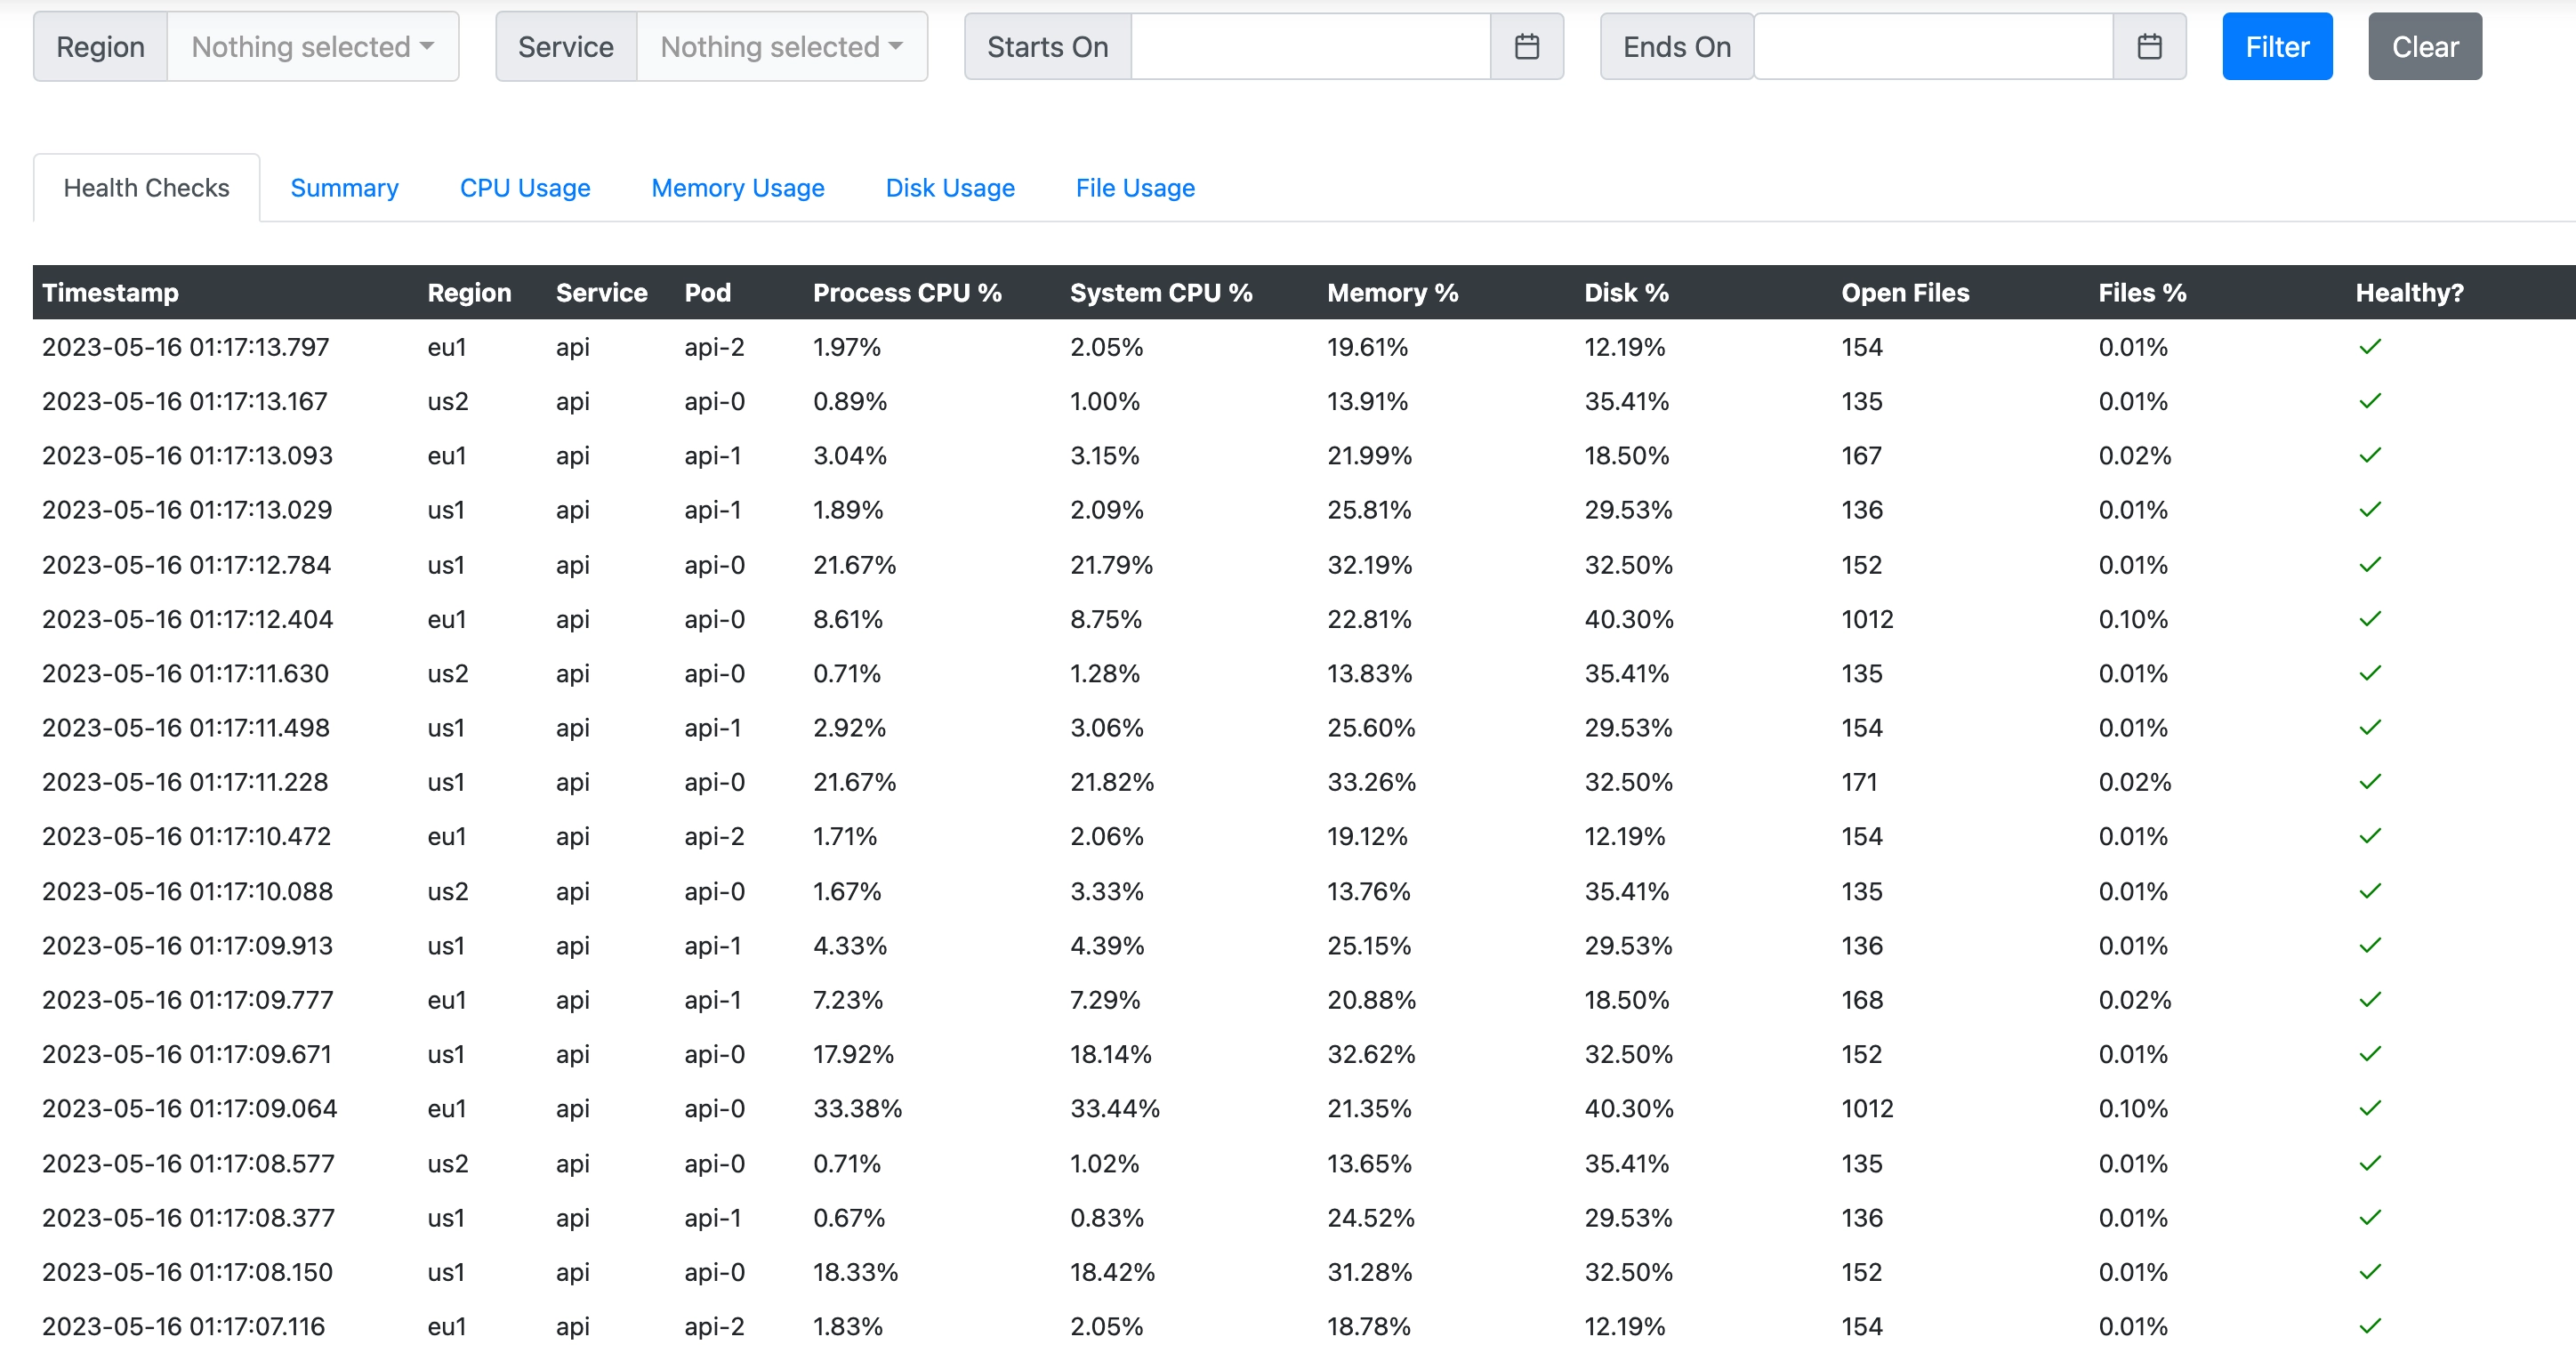
Reports
Easily choose what data you want to pull from the system, including workflows, the job queue, user activities and content weights. Select the type of report and then translate that into different chart formats. Glean insights from metrics such as most active content contributors, content age, most valuable content by graph axis and publishing job execution throughput.
-
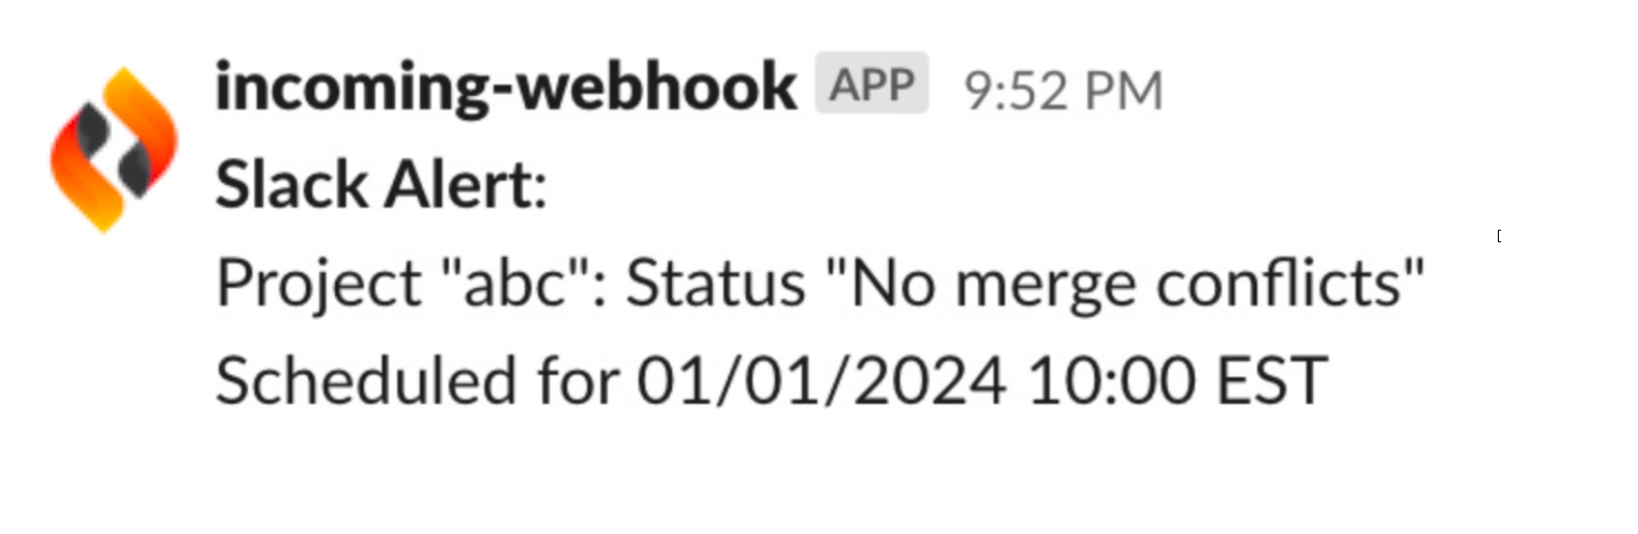
Alerts and Notifications
Receive notifications via Email, SNS, Slack and more whenever certain performance thresholds are triggered, allowing you to expedite the appropriate intervention and response.
-
Export
Export your generated reports to output file formats including Excel, CSV and JSON for use in external tools and business intelligence products.
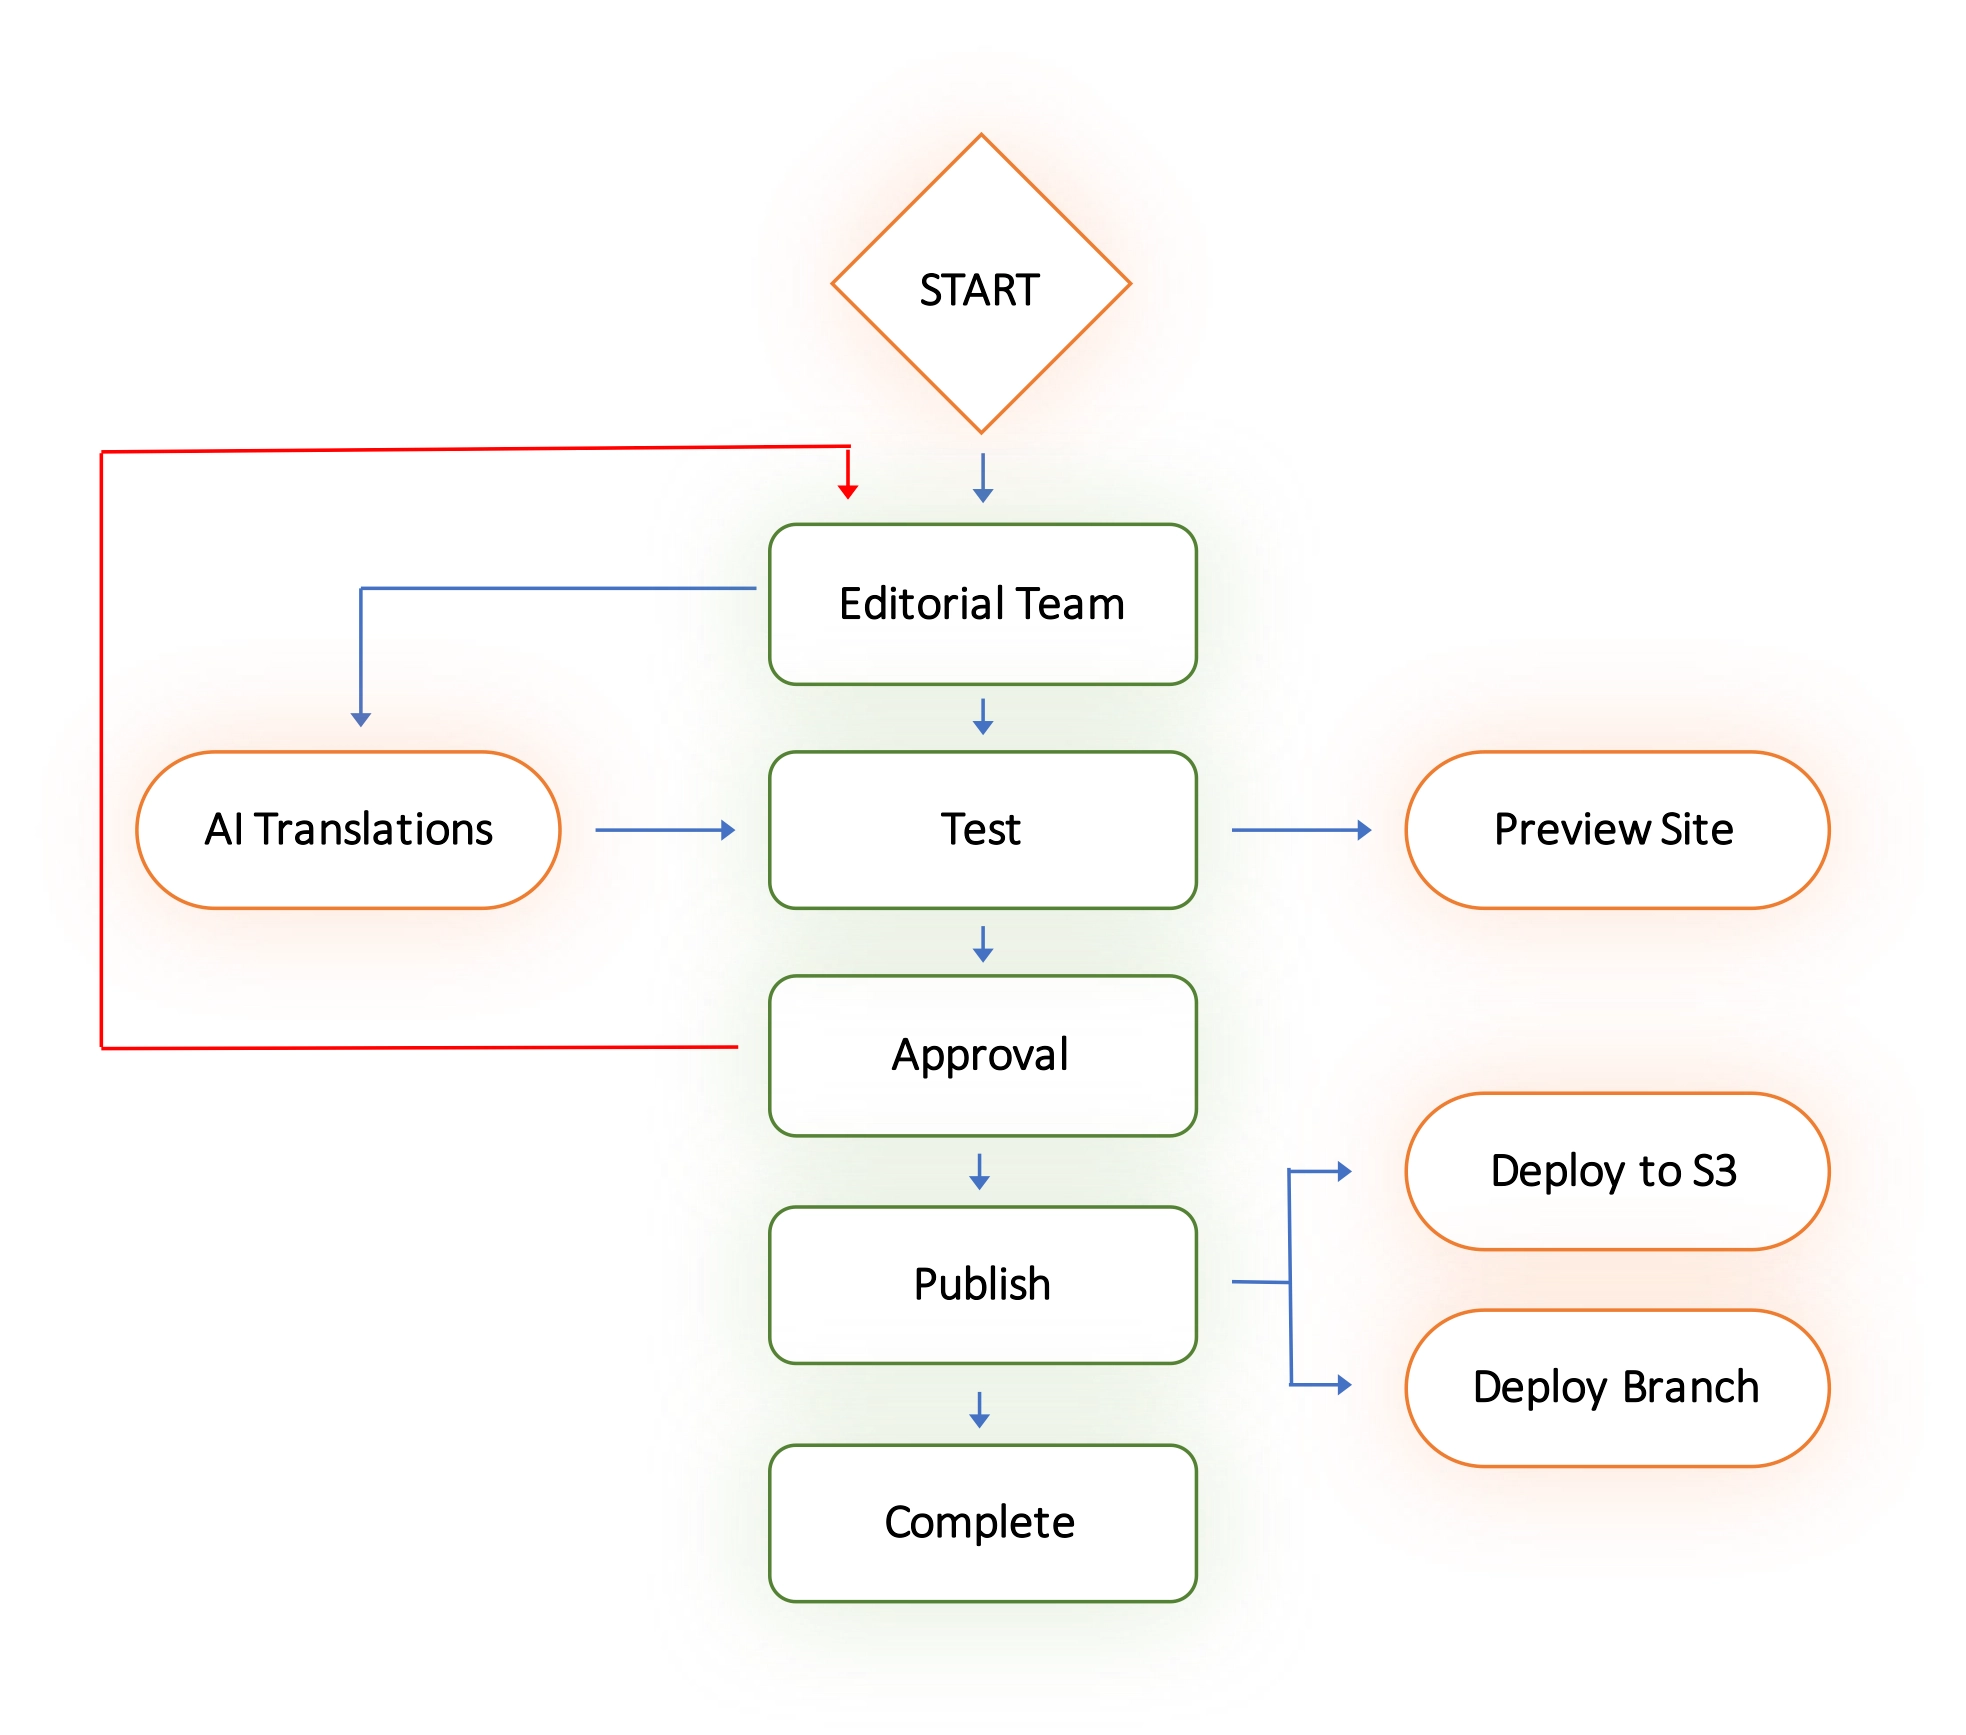
Automatic Reports for Every Step in the Process
As your team works, reports are automatically generated for you! Keep an eye on process flows and easily spot bottlenecks and places where things can be improved.
-
Workflow Monitoring
The workflow engine tracks every contribution, change, transition and unit of work achieved during the process flow. The workflow monitor watches all of this and performs operations on your behalf, such as signalling and generating reports.
-
Automatic Report Generation
Reports are automatically generated as your team works with the system. Every content change or workflow transition is tracked and timed. Statistics are calculated and provide actionable flow insights into what's working well and where bottlenecks may reside.
-
Notifications
Configure notifications that automatically trigger when a threshold is exceeded -- such as a step in your workflow process taking too long or a unit of work falling behind schedule.
Real Time Business Intelligence
Connect your Gitana platform to a real-time message queue that receives event messages for every type of interaction, including changes to content, branch merges and publishing pushes. As events are raised, messages are placed onto the message queue, allowing for real-time integration to business intelligence tools and your greater composable, Enterprise architecture.
-
Message Queue
Messages are placed onto your configured Queue in real-time, as they happen. This allows for external monitoring tools to receive these events, transform them and feed them into third-party products for quasi real-time, external analysis.
-
Data Feed
Each entry in the data feed is tagged with metadata describing the origin of the event, allowing you to segment downstream by project, user, content, branch and action type.
-
Business Intelligence
Route the data feed into Business Intelligence tools for aggregation of the feed with those of other vendor systems to provide greater insight into how Gitana data activity correlates alongside your CRM, Marketing Platform, Support Portal and other custom applications.
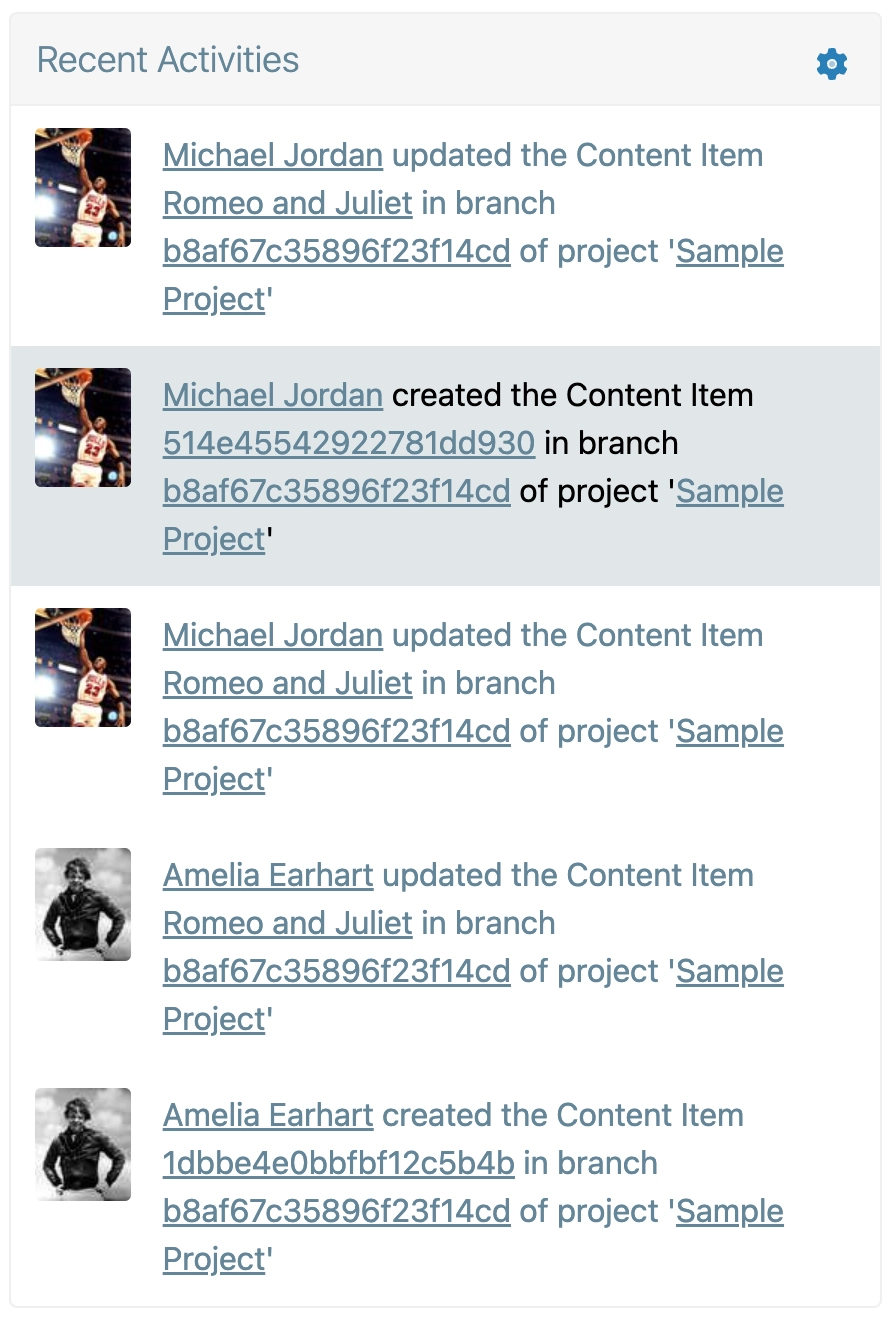
Track User Activities as they Happen
The activities of your users against content flows into an Activities data stream that provides real-time query and tracking of what's happening across your users, branches, projects and business. Connect this stream to business intelligence software to enhance real-time insights.
-
Real Time
Activities information is captured in real-time and aggregated into a stream that allows for time-constrained queries.
-
Query
Search for activities by user, branch, project, content item and time. Activities include when content items were modified, when branches were merged and when a release went live and was published.
-
External Feed
Feed the Activities stream into an external consumer, such as AWS Kinesis, to capture or route that flow of information to external tools such as business intelligence applications.
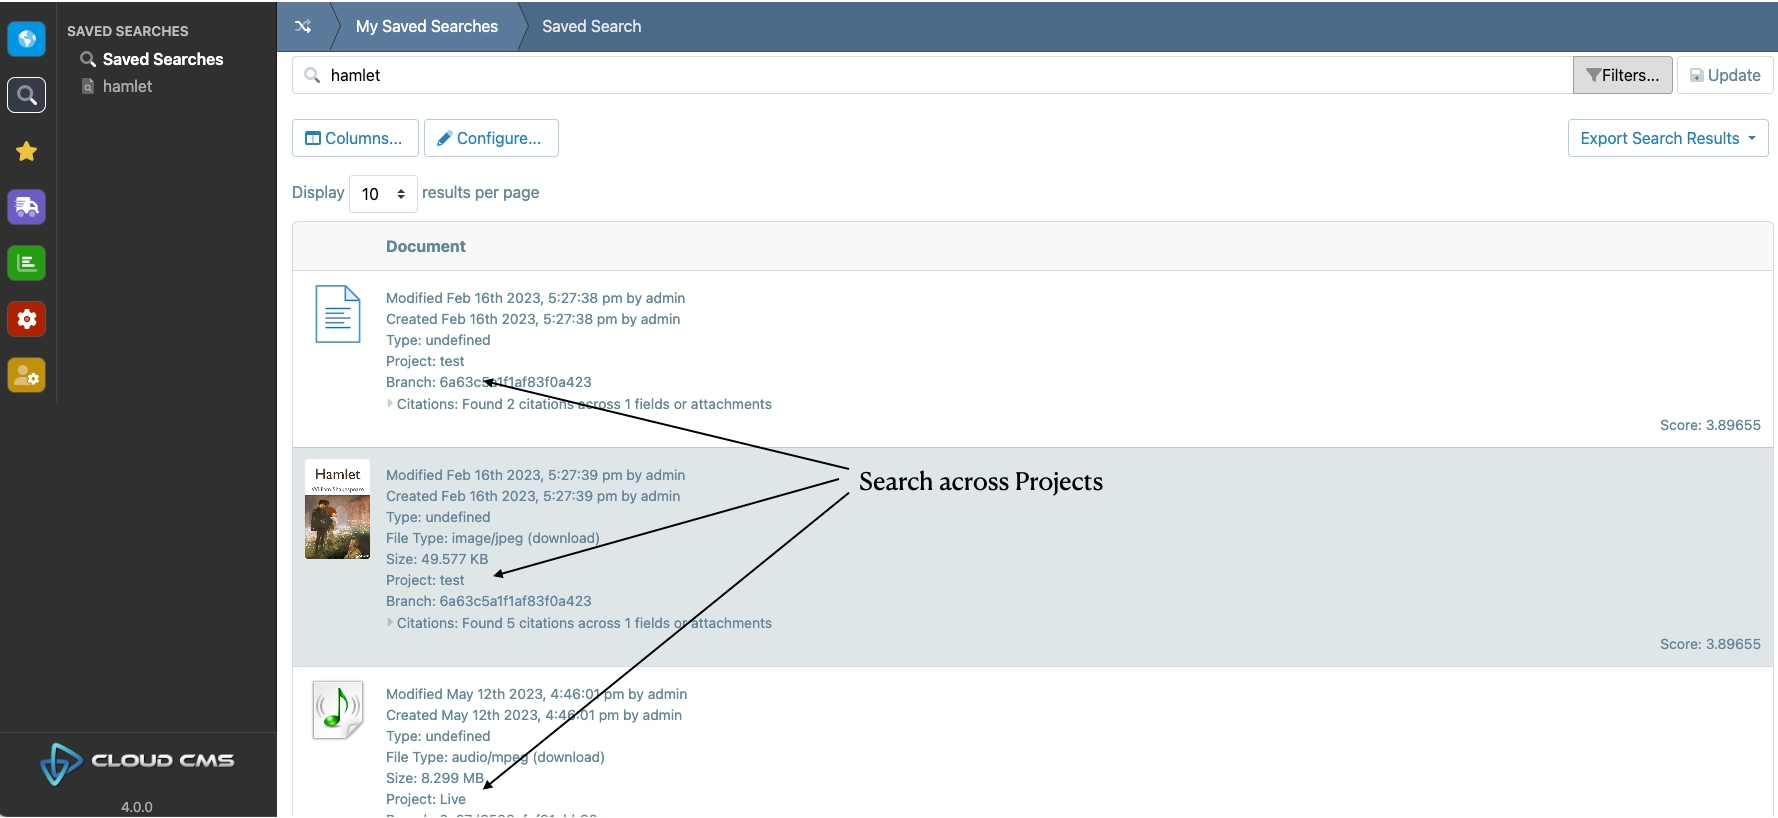
Federated Search across All of your Content
Build powerful searches that run some or all of your projects, branches and content items to find the exact content you're looking for. Design columnar reports that show you the results as you want to see them. Save your searches for easy access and export results to Excel, CSV, JSON and ZIP.
-
Search and Query
Define your search using both the Search and Query DSLs within Gitana. This lets you take advantage of the best that Elastic Search and MongoDB offer respectively. Search for content using textual terms and text query strings that incorporate boolean logic and textual operators.
-
Across all of your Projects and Branches
Run your searches against a single project or multiple projects. Run them against a single specified branch in each project or against multiple projects across many projects. Search results are scored and presented in a unified result set.
-
Saved Searches, Formats and Exports
Save your Searches so that you can quickly come back to them. Format them by choosing columns and display properties. And then export them as Microsoft Excel, CSV, JSON and ZIP files.
Enterprise Auditing for Regulatory Compliance
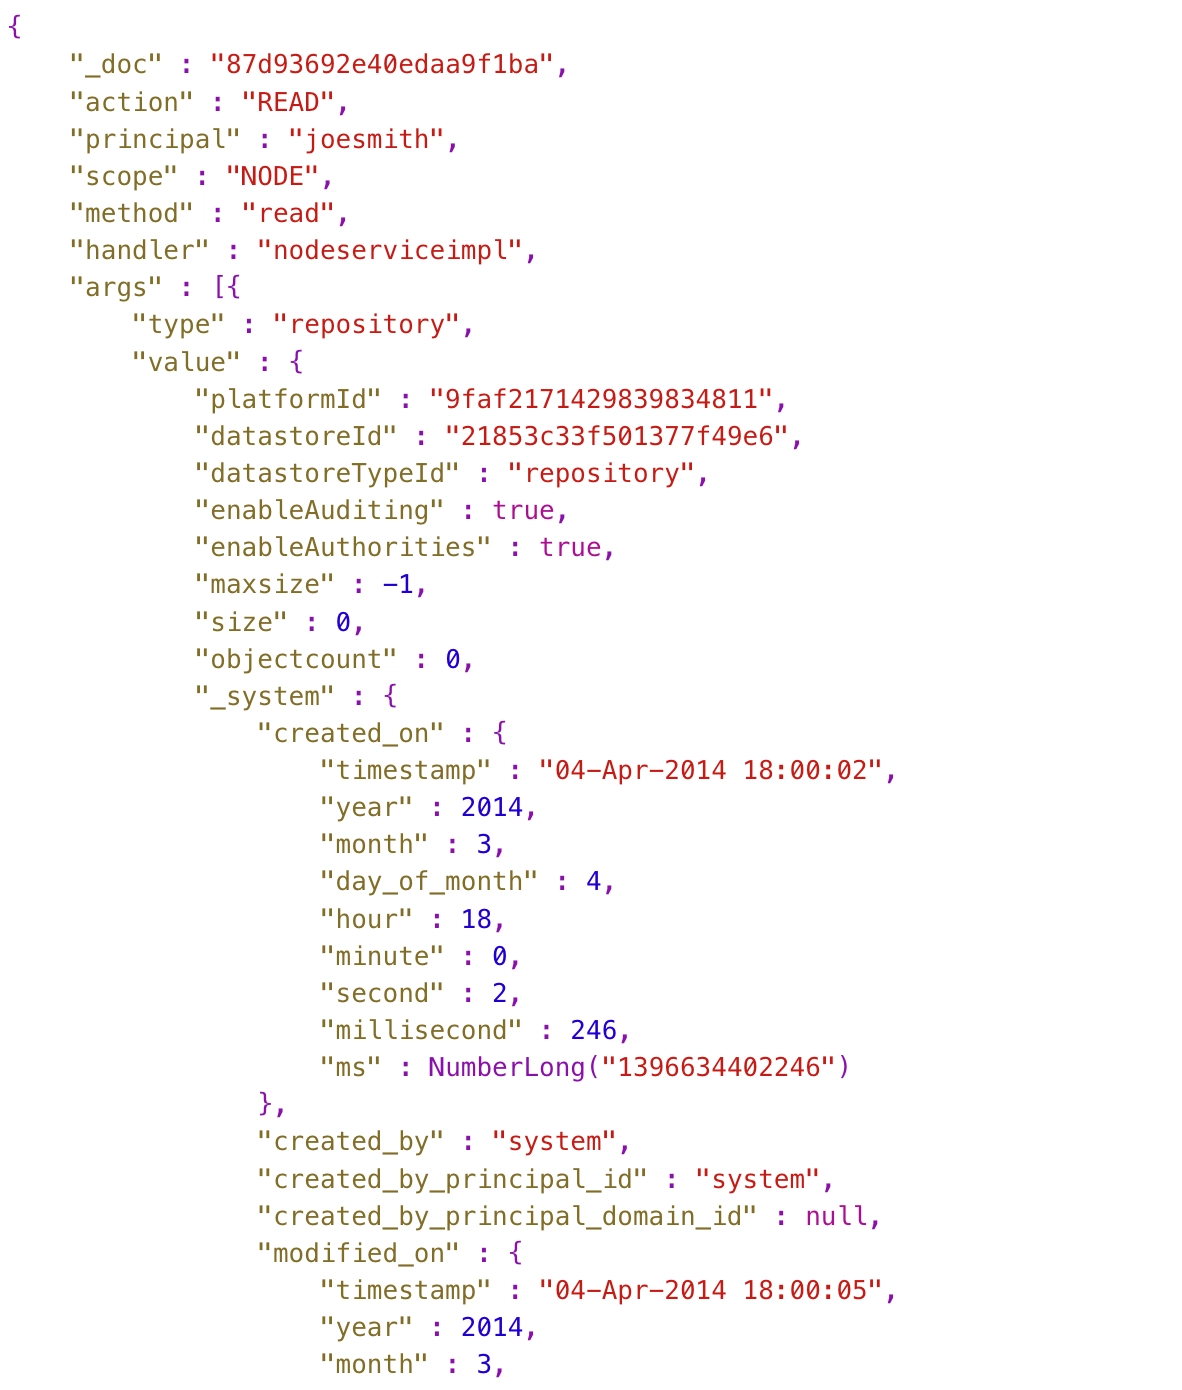
Log every interaction with the core system, down at the service level to record each principal, resource and method invocation (including arguments, the result, timing and system information) to produce a rich and detailed audit trail for use in regulatory compliance initiatives.
-
Audit Trail
The audit engine captures every single method invocation within the service-layer of the Gitana Java data engine. Audit logs are captured to disk in JSON format and provide extremely precise detail on everything that happens in the system.
-
Self-Hosted or Dedicated Only
The audit engine feature is only available for dedicated SaaS or self-hosted Gitana installations.
-
Logging and S3 Rollover
Audit logs are written using the Log4j2 engine and, as such, can be configured easily for rollover and passivation for glacial storage. Integration is also provided out-of-the-box for automatic upload to Amazon S3 upon rollover.
Ready to Get Started?
Unlock your data with smart content services and real-time deployment